
Brandes Global Opportunities Fund Series F (CAD)

- Distribution Frequency: Annually
- Number of Holdings: 75
- Total Net Assets: C$413 M
REASONS TO OWN
Features
- All-cap flexibility unconstrained by indices
- Holds high-conviction names from across the firm
- Low portfolio valuations (e.g., P/E, P/B)
- Distributions paid annually
- Unhedged foreign currency exposure
Benefits
- Consistent value approach ensures no style drift
- Leverages the best ideas from across Brandes
- Covers off all market caps in a single portfolio
- Potential for long-term outperformance
- Exposure to a broad basket of foreign currencies
Videos
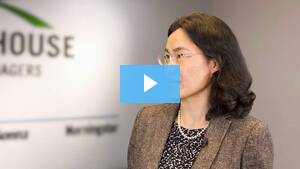
Yingbin Chen, Director, Investments Group, at Brandes answers your key questions about the Brandes Global Opportunities Fund.
Portfolio Sub-Advisors
Fundserv : BIP
| Fund Number | |||
|---|---|---|---|
| Series | C$ | US$ | |
| A | 114 | 116 | |
| F | 502 | 504 | |
Inception: June 29 2012|Series F (CAD)|MER: 1.30 %PERFORMANCE: Series F (CAD) | as of August 31 2026
| Annualized Performance (%) | 1-Mth | 3-Mth | 6-Mth | YTD | 1-Yr | 3-Yr | 5-Yr | 7-Yr | 10-Yr | Since Incept. | ||
|---|---|---|---|---|---|---|---|---|---|---|---|---|
| Brandes Global Opportunities Fund | 0.47 | 6.73 | 5.25 | 17.93 | 27.18 | 28.03 | 17.66 | 16.15 | 11.14 | 12.61 | ||
| MSCI AC World Index | 1.46 | 2.57 | 11.41 | 15.60 | 23.54 | 21.46 | 12.96 | 14.76 | 13.20 | 14.08 | ||
| Calendar Year Performance (%) | 2016 | 2017 | 2018 | 2019 | 2020 | 2021 | 2022 | 2023 | 2024 | 2025 | ||
|---|---|---|---|---|---|---|---|---|---|---|---|---|
| Brandes Global Opportunities Fund | 12.54 | 7.89 | -10.62 | 9.58 | -2.24 | 11.72 | -6.75 | 29.40 | 25.40 | 31.79 | ||
| MSCI AC World Index | 4.13 | 15.83 | -1.26 | 20.20 | 14.22 | 17.53 | -12.43 | 18.92 | 28.15 | 16.60 | ||
As of: August 31, 2026
$53,801.00GROWTH OF $10,000 SINCE INCEPTION
TOP 10 COUNTRIES
| Country | |
|---|---|
| United States | 24.7 % |
| United Kingdom | 10.6 % |
| France | 7.6 % |
| Mexico | 6.6 % |
| Germany | 4.6 % |
| Brazil | 3.9 % |
| Slovenia | 3.6 % |
| China | 3.4 % |
| Switzerland | 3.4 % |
| Spain | 2.9 % |
| Total | 71.3 % |
| Total # of Countries | 24 |
TOP 10 POSITIONS
| Security | |
|---|---|
| Nova Ljubljanska Banka GDR | 3.6 % |
| Cash & Cash Equivalent | 3.1 % |
| SAP SE | 2.6 % |
| Magyar Telekom PLC | 2.6 % |
| Millicom International Cellular SA SDR | 2.5 % |
| Samsung Electronics Co Pfd ORD | 2.4 % |
| Alibaba Group Holding Ltd. | 2.2 % |
| Heineken NV | 2.0 % |
| Becton Dickinson & Co | 2.0 % |
| Walmart de Mexico SAB De CV | 2.0 % |
| Top 10 Total | 25.0 % |
| Total # of Securities | 75 |
SECTOR EXPOSURE
| Sector | |
|---|---|
| Health Care | 17.2 % |
| Financials | 16.2 % |
| Consumer Staples | 13.2 % |
| Communication Services | 12.0 % |
| Information Technology | 11.4 % |
| Consumer Discretionary | 10.1 % |
| Energy | 5.4 % |
| Industrials | 4.7 % |
| Real Estate | 4.0 % |
| Materials | 2.5 % |
| Other | 3.3 % |
| Total | 100.0 % |
ASSET MIX
| Asset breakdown | |
|---|---|
| Global Equity | 95.9 % |
| Canadian Equity | 0.8 % |
| Other | 3.3 % |
| Total | 100.0 % |
REGIONAL MIX
| Region | |
|---|---|
| Europe | 43.8 % |
| North America | 25.5 % |
| Asia | 14.2 % |
| Latin America | 13.1 % |
| Other | 3.4 % |
| Total | 100.0 % |
RELATED DOCUMENTS & MEDIA
Bridgehouse Asset Managers® is a trade name of Brandes Investment Partners & Co. As manager of the Bridgehouse Funds, Bridgehouse has hired certain portfolio sub-advisors to the Funds. Units and shares of the Bridgehouse Funds are available through registered dealers only and are not available through Bridgehouse. Bridgehouse and its sub-advisors have taken reasonable steps to provide accurate and current data. The data has been gathered from sources believed to be reliable, however Bridgehouse and/or its sub-advisors are not responsible for any errors or omissions contained herein. The foregoing reflects the thoughts, opinions and/or investment strategies of Bridgehouse and/or its sub-advisors, which are subject to change at their discretion and without prior notice, based on changing market dynamics or other considerations. Securities mentioned herein are not to be construed as a recommendation to buy or sell. Commissions, trailing commissions, management fees and expenses all may be associated with mutual fund investments. Please read the prospectus before investing. The indicated rates of return are the historical annual compounded total returns including changes in unit value and reinvestment of all distributions and do not take into account sales, redemption, distribution or optional charges or income taxes payable by any securityholder that would have reduced returns. Mutual funds are not guaranteed, their values change frequently and past performance may not be repeated. Performance is shown for the class selected.Performance is net of fees unless otherwise indicated.Indices are unmanaged and cannot be directly invested into. MSCI has not approved, reviewed or produced this report, makes no express or implied warranties or representations and is not liable whatsoever for any data in the report. You may not redistribute the MSCI data or use it as a basis for other indices or investment products.

